User guide
How to use Football Quant
Football Quant is an information and analytics service for studying football matches, team statistics, competition metrics and sporting events. The platform combines the match calendar, results, odds, historical statistics and its own analysis tools.
Some features are free. Extended analysis is available through the paid products Analytics and Signals. The service is not a bookmaker, does not accept bets and does not guarantee sporting or financial results.
1. Getting started
You can start without buying a subscription. The open football section shows the schedule, results and basic match information.
An account is needed to manage subscriptions, configure notifications and access paid tools. After registration you can choose one or several products and purchase a subscription.
Part I. Free features
2. Calendar, score and match card
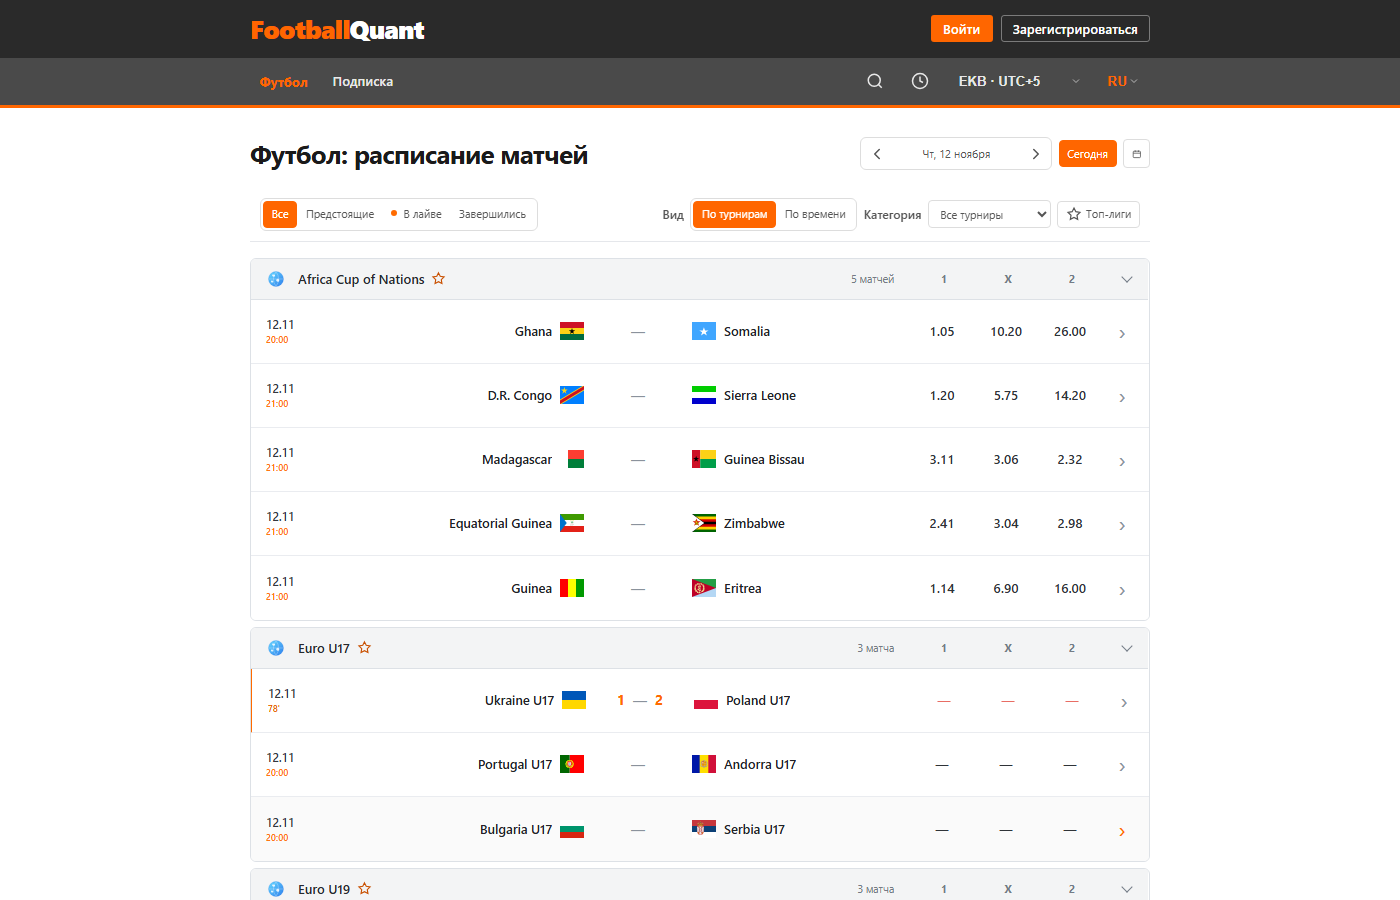
The calendar lists matches by competition and date: teams and badges, kick-off time, the current or final score and available 1X2 odds. Switch between "All", "Upcoming", "Live" and "Finished".
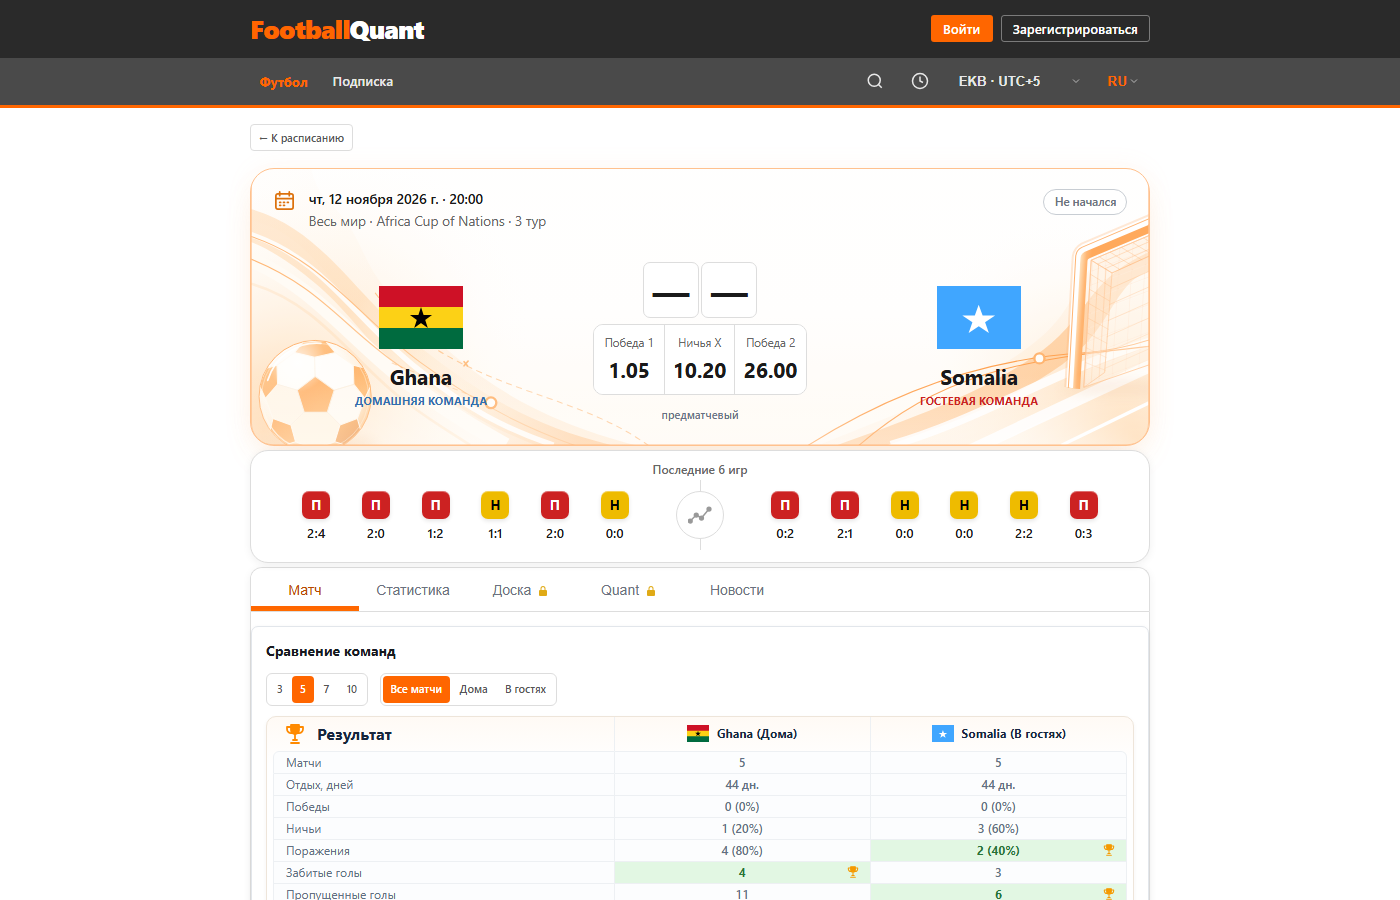
The match card opens when you click a row. It contains the match header, the last six results, team comparison, statistics, head-to-head and news.
Live: what is free
During a match you can see the score, match time, goals, half events and red cards. Extended metrics - possession, shots and shots on target, corners and yellow cards - belong to the Analytics subscription. Data coverage depends on the competition and the provider, and updates may be delayed.
Free leagues to explore Football Quant
To let you explore the analytics on real data, two competitions are fully open without a subscription:
- English Premier League (Premier League, EPL).
- German 2. Bundesliga (2. Bundesliga).
In matches from these competitions, free access includes not only the calendar and basic statistics, but also the tools that normally require Analytics:
- extended statistics: corners, cards, shots and shots on target, fouls, offsides, penalties, xG and xGA, possession;
- the Board and FQS-50;
- head-to-head with extended markets and hit rates;
- Quant: the probability model, market probabilities, EV, Kelly and hit rates.
This lets you evaluate the interface and the paid tools before purchasing a subscription. In other competitions the usual split applies: basic statistics are free and extended analytics requires Analytics.
3. Team comparison and odds
Free team comparison is available in the match card: a sample of the last 3, 5, 7 or 10 matches and the conditions "All matches", "Home" or "Away". It compares results, goals scored and conceded, goals by half and other available metrics.
The odds section shows pre-match 1X2 prices and, where history is available, the opening and latest values with timestamps. Line movement is a change in the market price, not proof of an outcome.
4. History, head-to-head and the hit-rate filter
The history section lets you study past matches by season, competition and period: home and away games, recent meetings, results by competition and head-to-head records.
H2H shows the meetings between two teams. It should be read together with current form: squads and coaches change over time.
The hit-rate filter shows how often a selected outcome occurred in the historical sample. For example, over 1.5 goals in 8 of 10 matches is 80%. Historical hit rate is not a guaranteed probability for the next match.
League table
The table shows matches played, wins, draws, losses, goals and points. It helps compare a team's position with its recent form.
Part II. Analytics - advanced analysis
5. What the Analytics subscription includes
Analytics is a separate paid product. The subscription unlocks extended statistics: corners, yellow and red cards, shots and shots on target, fouls, offsides, penalties, xG and xGA, possession and other available metrics.
It also includes two analysis tools - the Board and Quant - and extended statistics sections in the match card.
| Feature | Free | Analytics |
|---|---|---|
| Calendar, score, results | Yes | Yes |
| Match card, form, 1X2 odds | Yes | Yes |
| Team comparison 3/5/7/10 | Yes | Yes |
| History, H2H, league table | Yes | Yes |
| Hit-rate filter | Yes | Yes |
| Extended statistics (corners, cards, shots, xG) | No | Yes |
| Board and FQS-50 | No | Yes |
| Quant: model and market analysis | No | Yes |
In the free leagues - the Premier League and 2. Bundesliga - Analytics tools, including the Board, FQS-50 and Quant, are open to every visitor without a subscription.
6. The Board
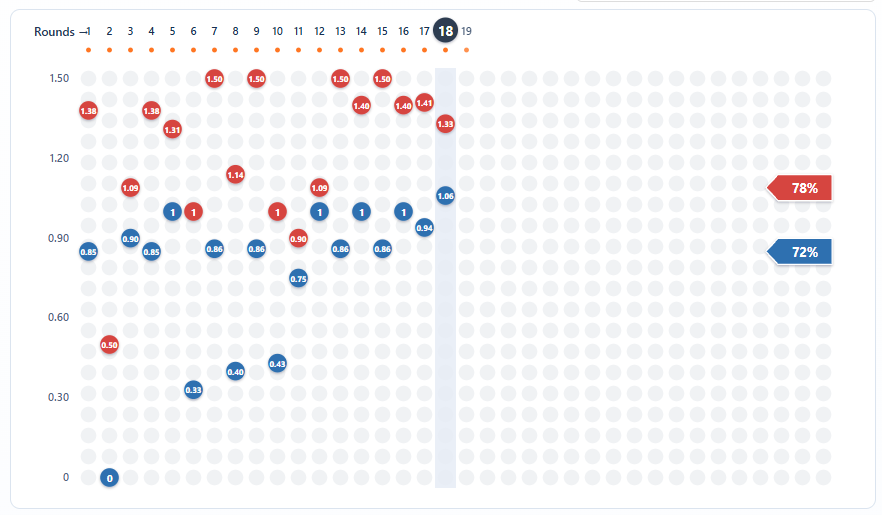
The Board is a visual analysis of how a team's metrics change from round to round. Unlike a results table, it shows momentum: improvement, decline and comparison with other teams in the competition.
You can choose the competition and season, the teams to compare, home or away matches, the period (full match, first or second half), values or ranks, the colour scale, the statistical coverage threshold and the sample depth.
Every point relates to a specific match and metric. It is a research tool, not an automatic confirmation of a future outcome.
7. FQS-50 - current form rating
FQS-50 is Football Quant's own metric on a 0-50 scale. It rates a team's current form from its latest completed matches (up to four) and lets you compare it with the league position and with other teams.
A league table reflects accumulated results for the season. FQS-50 shows how much recent form differs from that position: a team may sit in mid-table yet rank higher by FQS-50, and vice versa.
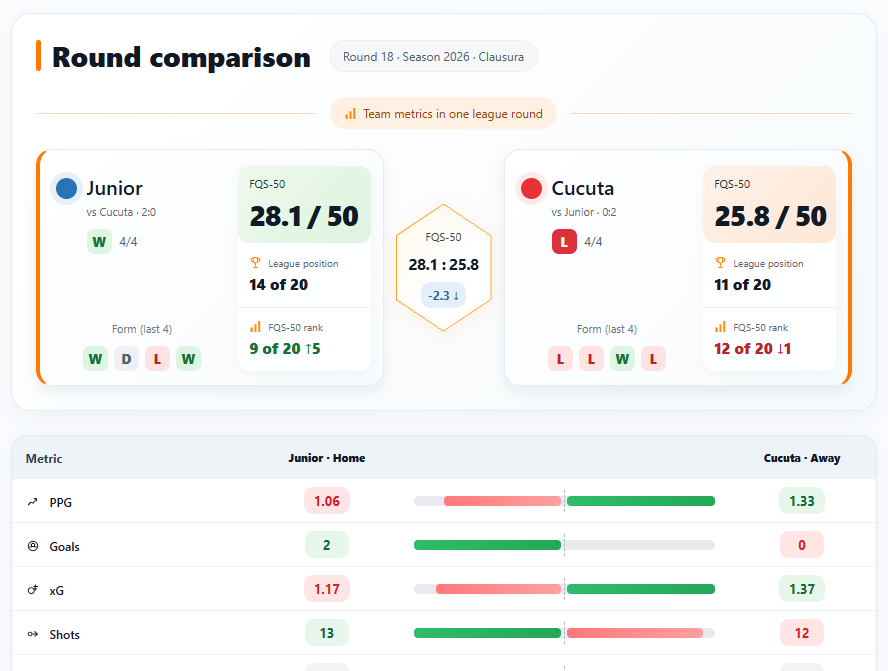
Important: FQS-50 is a form rating, not a win probability. It does not guarantee a result, and its methodology is the intellectual property of the service.
Part III. Quant - the mathematical model
8. How Quant works
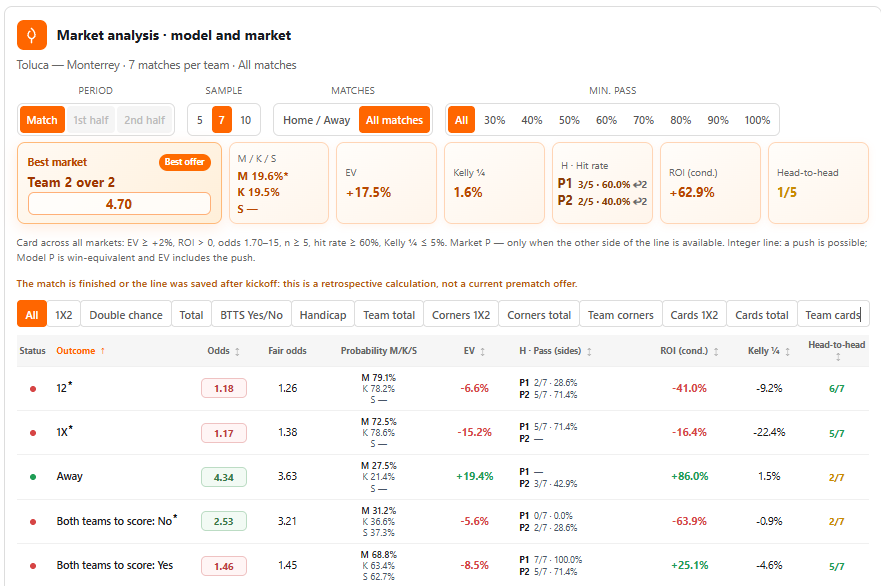
Quant builds football outcome probabilities from historical match data. The model estimates the expected goals of each team and derives a score distribution, from which outcome probabilities are calculated.
Next to the model, the bookmaker market estimate is shown: odds are converted into implied probabilities and, where the calculation is available, the bookmaker margin is removed. This allows an independent estimate to be compared with the market.
9. Fair odds, EV, ROI and Kelly
Fair odds are the price derived from the model probability without the bookmaker margin. Comparing them with the market price shows the gap between the model and the offer.
EV (Expected Value) is the mathematical expectation for a given probability and odds. Positive EV means potential value only if the probability estimate is correct.
ROI shows the result of the selected market on the historical sample. Past ROI does not guarantee future returns.
Kelly ¼ is the calculated share of capital from the Kelly formula, based on probability and odds; it is labelled Kelly ¼ in the interface. It is a mathematical reference, not a staking recommendation: with a wrong probability, Kelly leads to losses.
10. Using Quant
Open the match card, select the Quant tab and the market you need. Set the period (full match, first or second half), the sample depth (5, 7 or 10 matches), home and away conditions and the minimum historical hit rate (30% to 100%).
Review model probabilities, market probabilities, EV, Kelly ¼ and hit rates. Read the model together with team form, statistics and competition context.
Part IV. Signals - ready-made sports signals
11. What Signals is
Signals is a separate paid product for users who prefer ready-made, selected signals instead of analysing every event themselves. The system uses statistics, team form, odds and selection rules; the exact selection conditions are defined by the service's internal algorithms.
Depending on the selection, signals cover outcomes, double chance, handicaps, totals and other supported markets. Availability depends on the sports schedule and the selection results.
12. Signal history and statistics
The account shows statistics for published signals over 7, 15 and 30 days and all time: number of signals, wins, pushes, losses, average odds, ROI, result in units, the cumulative result chart and a comparison by market type.
As of 12 November 2026, 425 signals were published over 30 days with ROI +23.4% and average odds of 2.29. This is the historical result of a specific period, not a promise of future returns: future results may differ.
13. Journal and Telegram
The account includes a signal journal: you can track selected signals and record the actual odds you took. This lets you evaluate your personal result separately from the service statistics.
The Telegram bot delivers signals after you link your account and enable notifications. The bot supports one additional live update per signal: it is sent at the 10th minute of the first half. If a current price cannot be found in fresh live data, the message says so explicitly.
A live notification does not place a bet. It is an informational message; the decision is yours. The in-play odds may be higher or lower than the opening price, and the market may become unavailable.
14. Risk and stake size
Even signals with positive historical statistics can be followed by losing streaks. One approach to risk control is a fixed share of capital per decision, for example 1%. This is an example of a conservative limit, not a guarantee of capital preservation.
Do not judge performance by a few individual results: analysis requires a sufficient history and must include both winning and losing decisions.
Part V. Account
15. Subscriptions and support
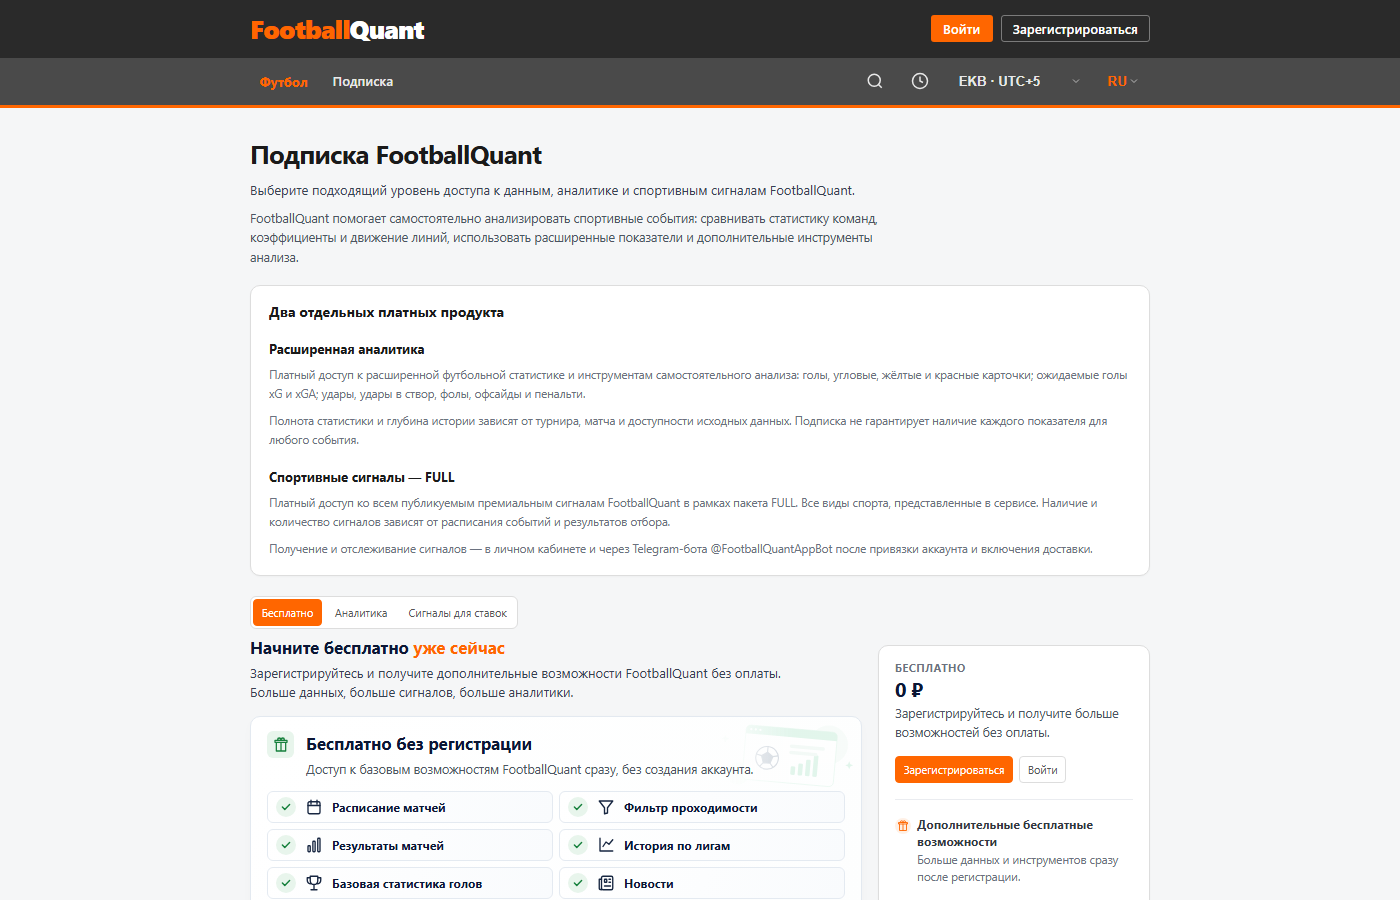
The account shows available products, subscription status, paid access periods, plans and payment history. Analytics and Signals are purchased separately; access is activated after payment confirmation, with no automatic renewal.
Questions about the service can be sent through the support section in your account. Contacts and registration details are published on the Contact page; payment and refund terms are in the Terms of Service.
Conclusion
Football Quant offers several levels of analysis: from the free calendar and basic statistics to advanced models and ready-made signals. No metric, model or signal guarantees an event or a profit.
Use the analytics with the probabilistic nature of sport and the limits of historical data in mind.